Understanding Origins and Fusion of Music Genres
Approach
Inital Sketches
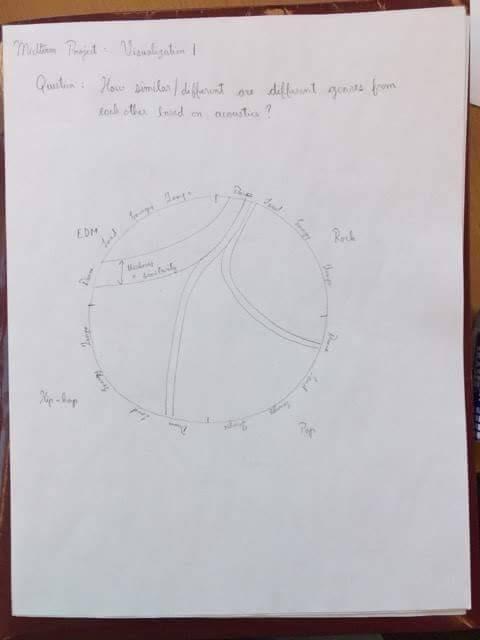
In the initial scope of design, we were going to look at the similarity between genres based on acoustics. In this sketch, each chord linking genres represents similarity of an acoustic feature. But this design posed the challenge of representing similarities based on each acoustic in a single diagram.
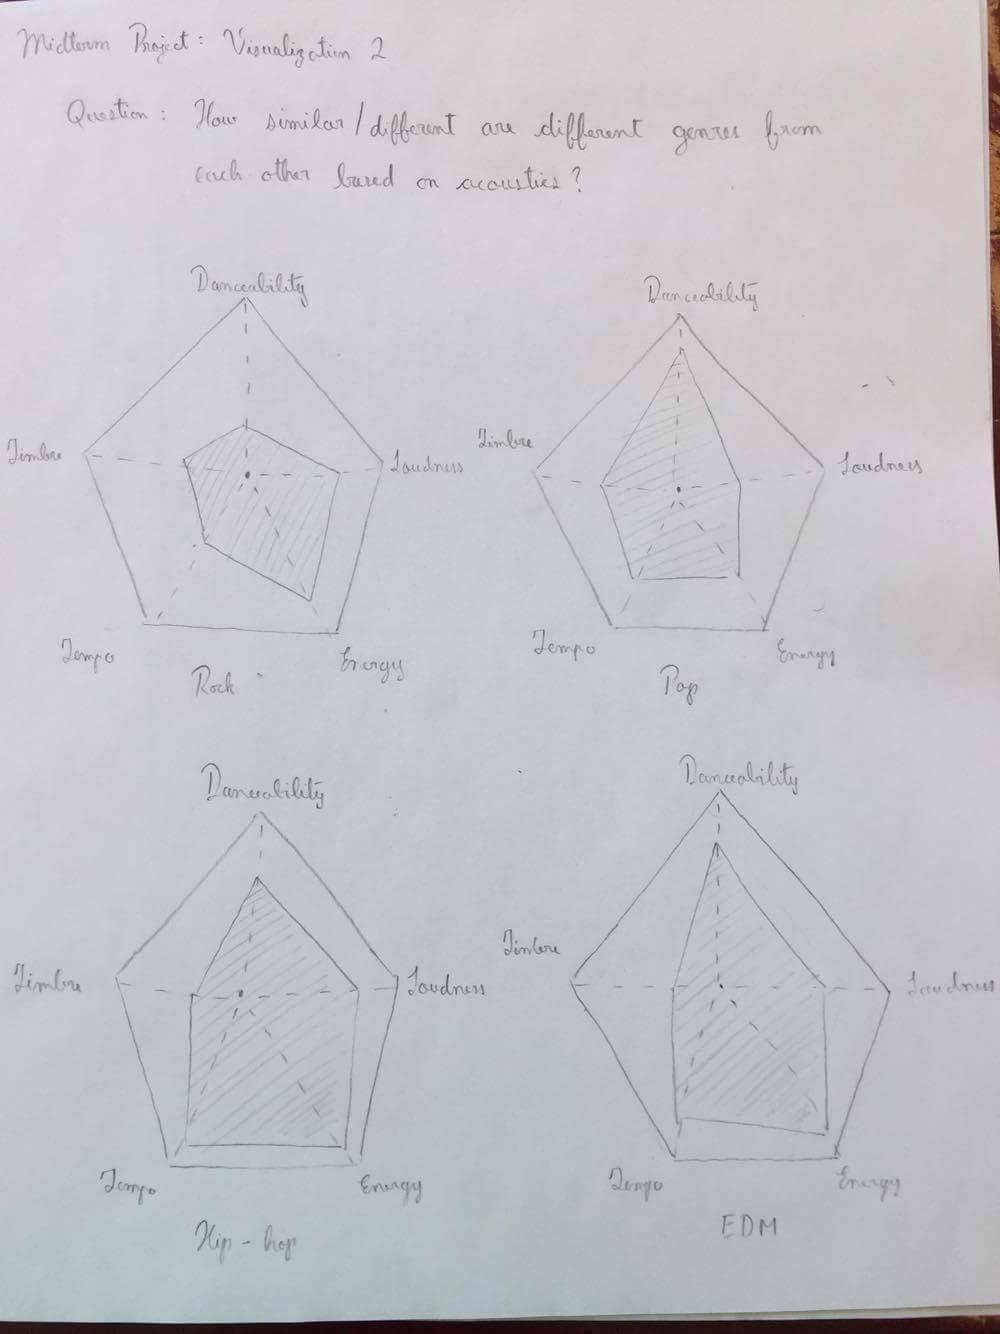
We also thought of using polygonal plots to visualize similarity between genres.
A major challenge with this design was the sparsity of data for acoustic features. Most of these attributes were 0 in the million song dataset, except loudness and tempo. We did find other acoustics, like variations of timbre, that could explain similarity but they were not intuitive enough to represent in a plot like this.
Variation over time
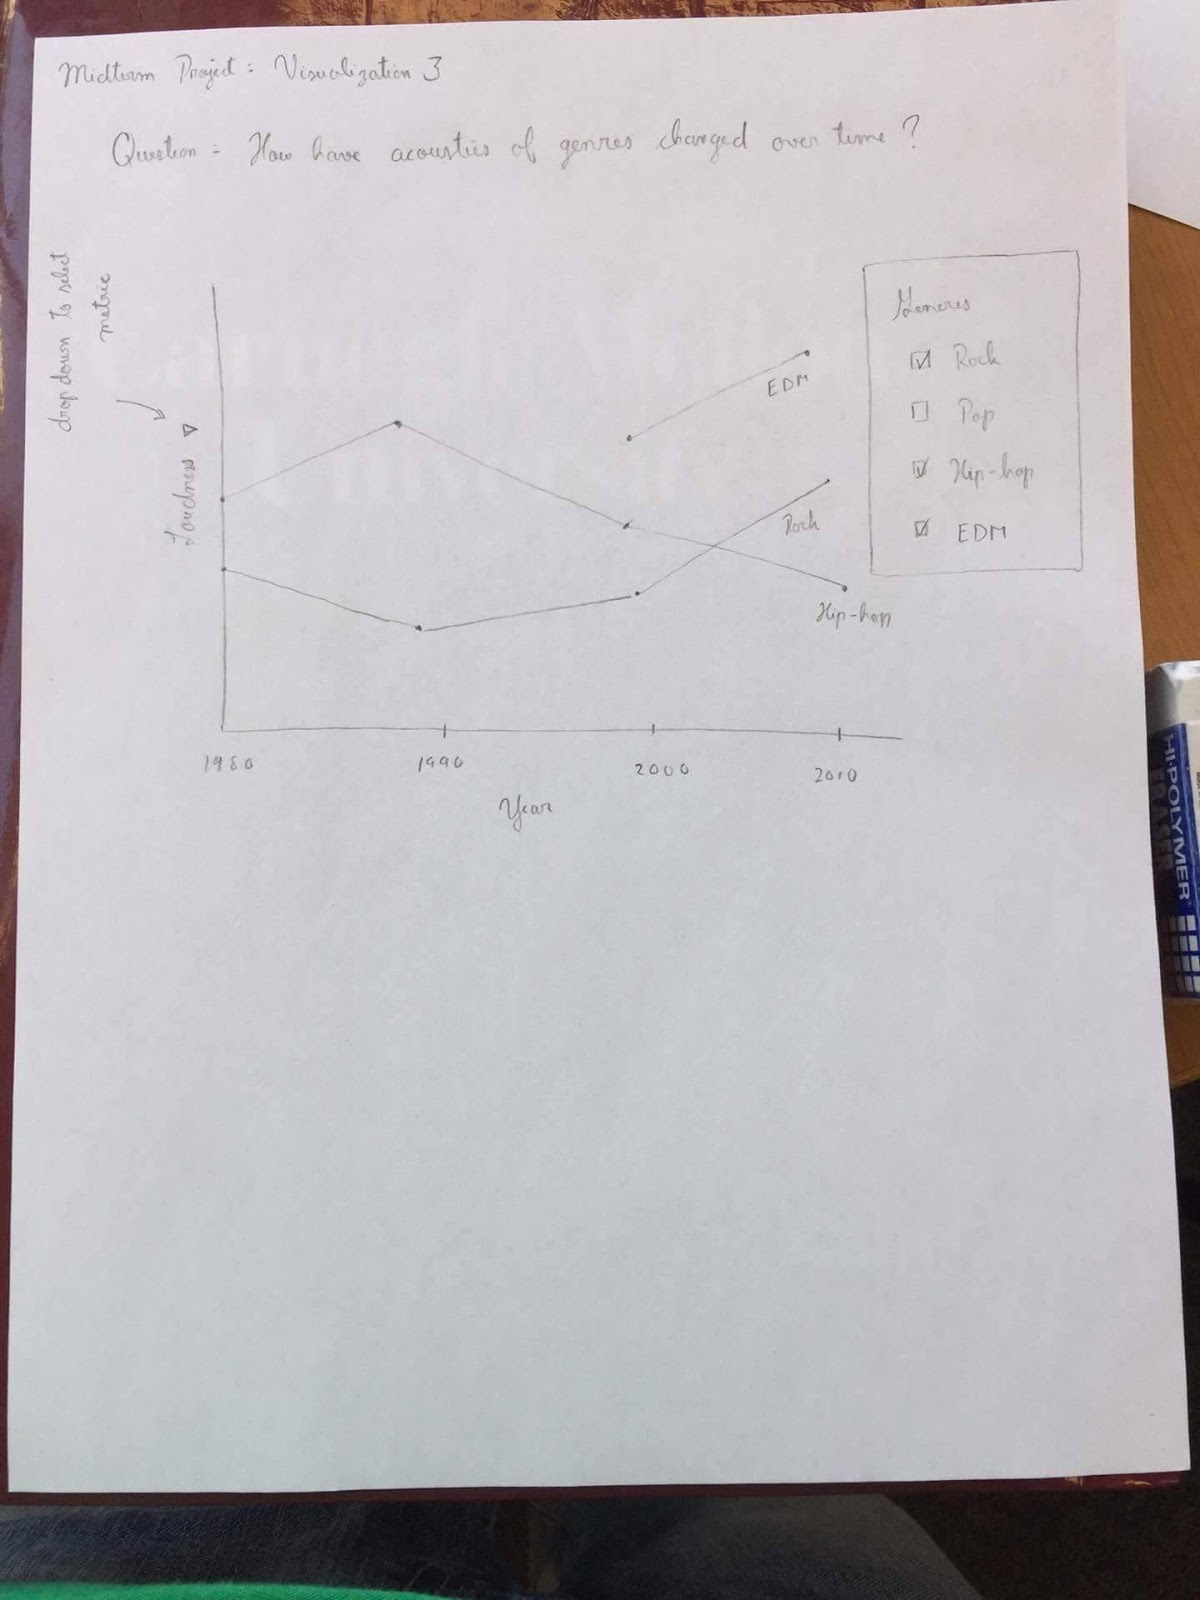
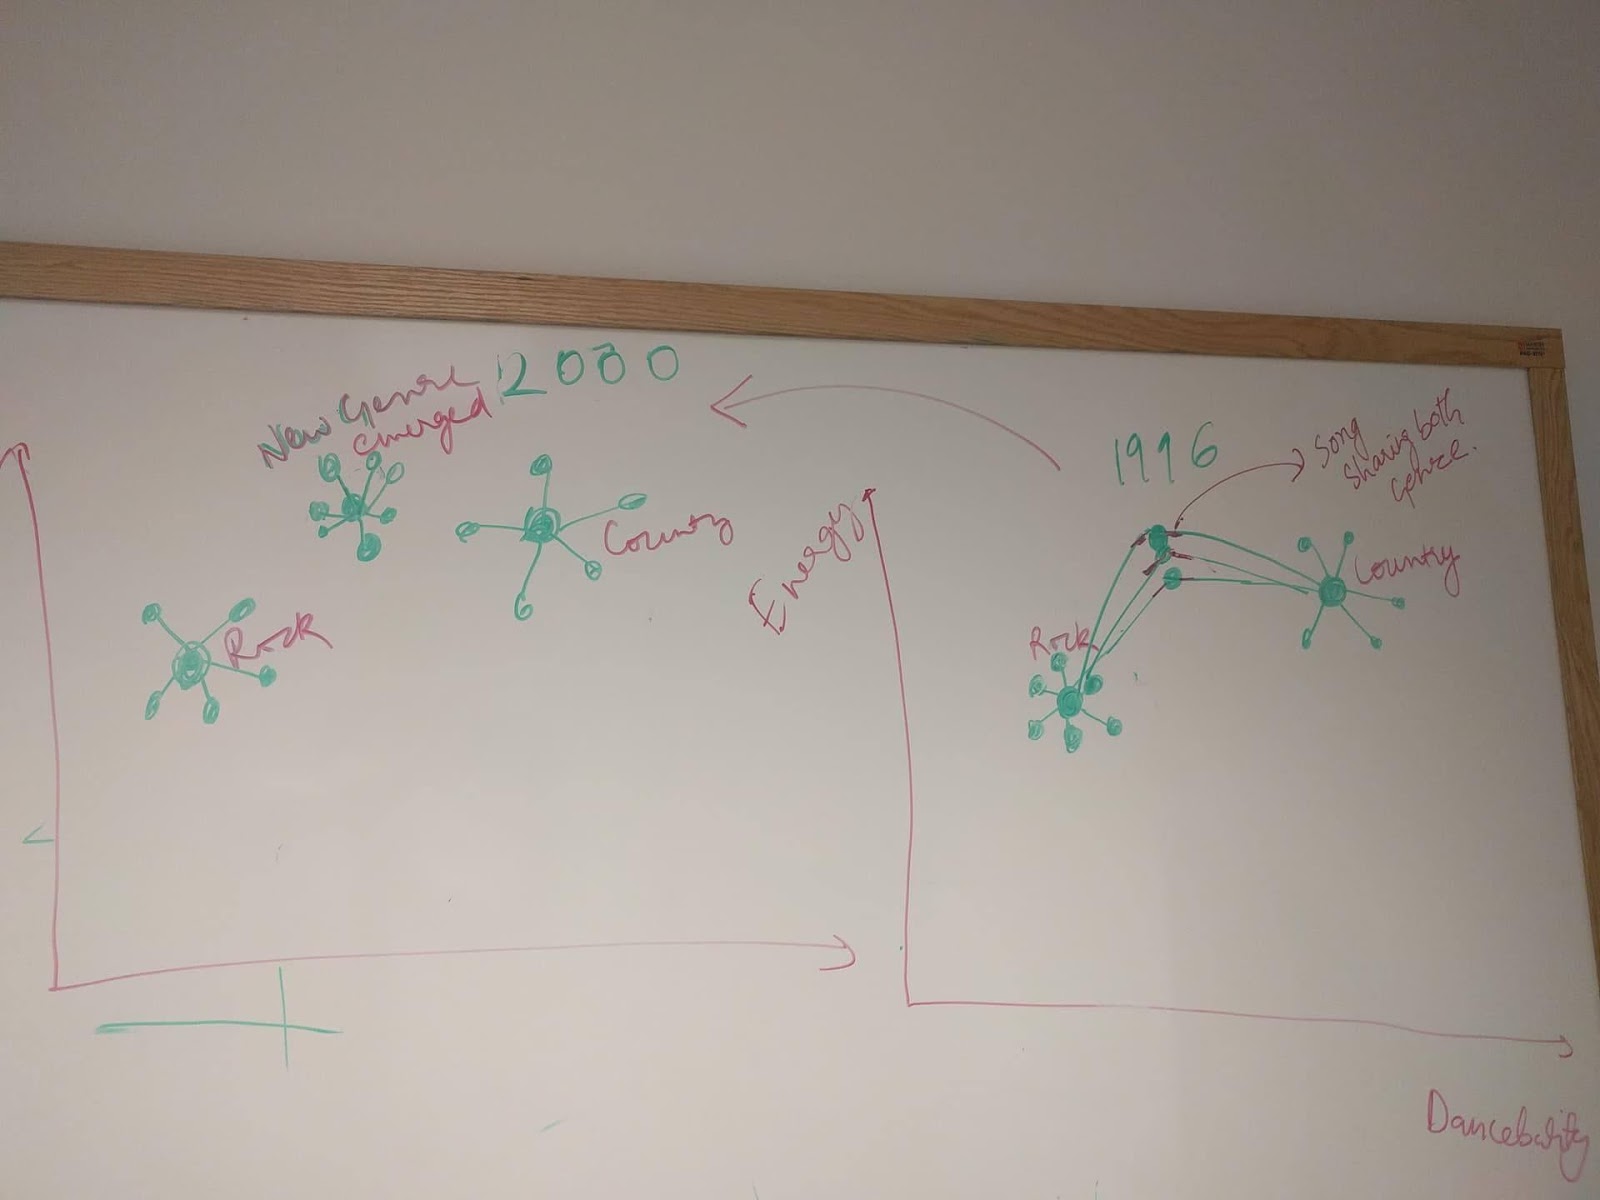
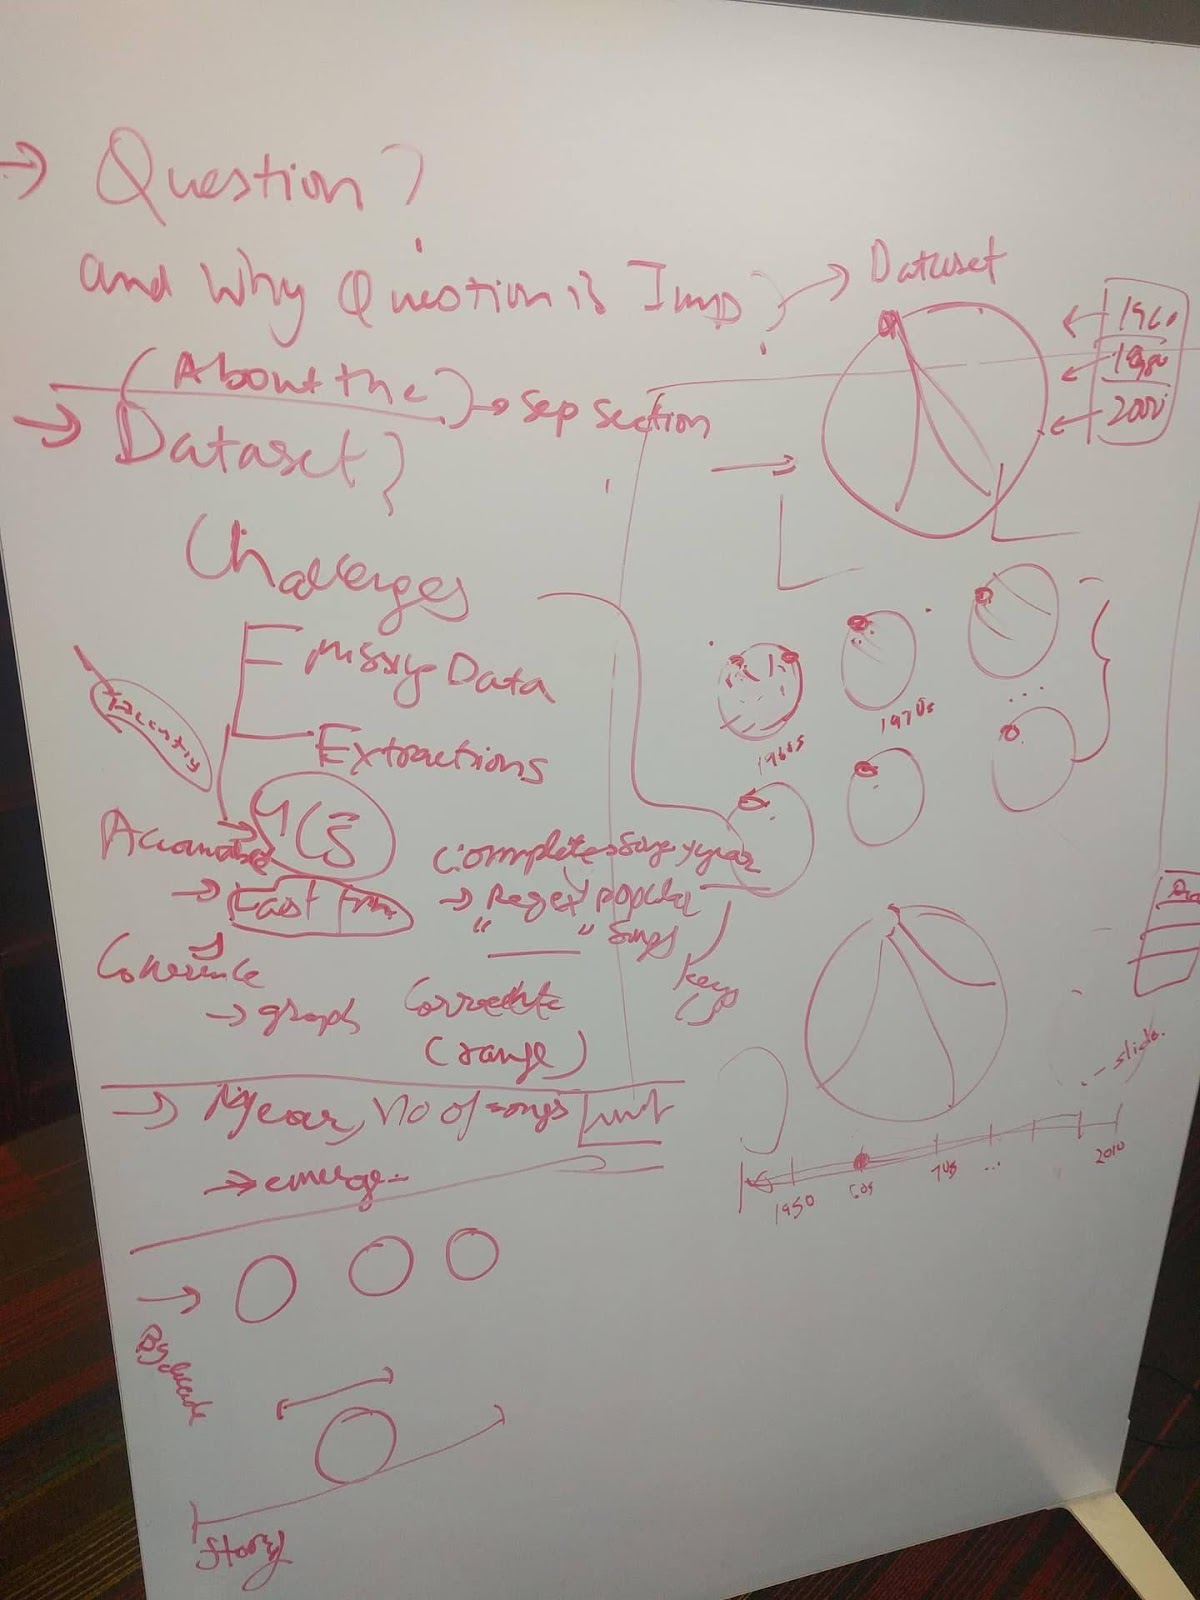
In the initial design, we thought of representing the acoustics over time with a line plot and a dropdown selection for genre. In the second iteration, we thought of clustering the genres based on two acoustics: energy and danceability. And then we would show the plots changing over time. Our hypothesis was this would show the emergence of a new genre. Again, sparsity of acoustic attributes was a major challenge for both these designs.
User Feedback
We were visualizing the data by year initially. After user testing, we got the feedback that this is probably too much information. Also, music is generally defined by decades. So, we decided to aggregate our analysis and visualizations for each decade.
Initially, we had different chord diagrams for each decade, which we displayed as small multiples. We decided to display them all to the user so that different decades can be compared. However, this didn’t add much value to readability and we received feedback that we should perhaps find a way to animate the timeline. We came up with a solution that solves both issues - a slider to switch between decades. Users can compare two decades, as well as see the change over time.
We had planned to show acoustics on the chord diagrams so that user could understand where similarities were coming from. Showing all the acoustics, however, was not intuitive because acoustics had 12 different variables for timbre. They were hard to visualize and interpret with the chord diagram. Hence, we decided to show a heatmap of similarities computed over all acoustics, rather than showing each acoustic separately.
Final designs
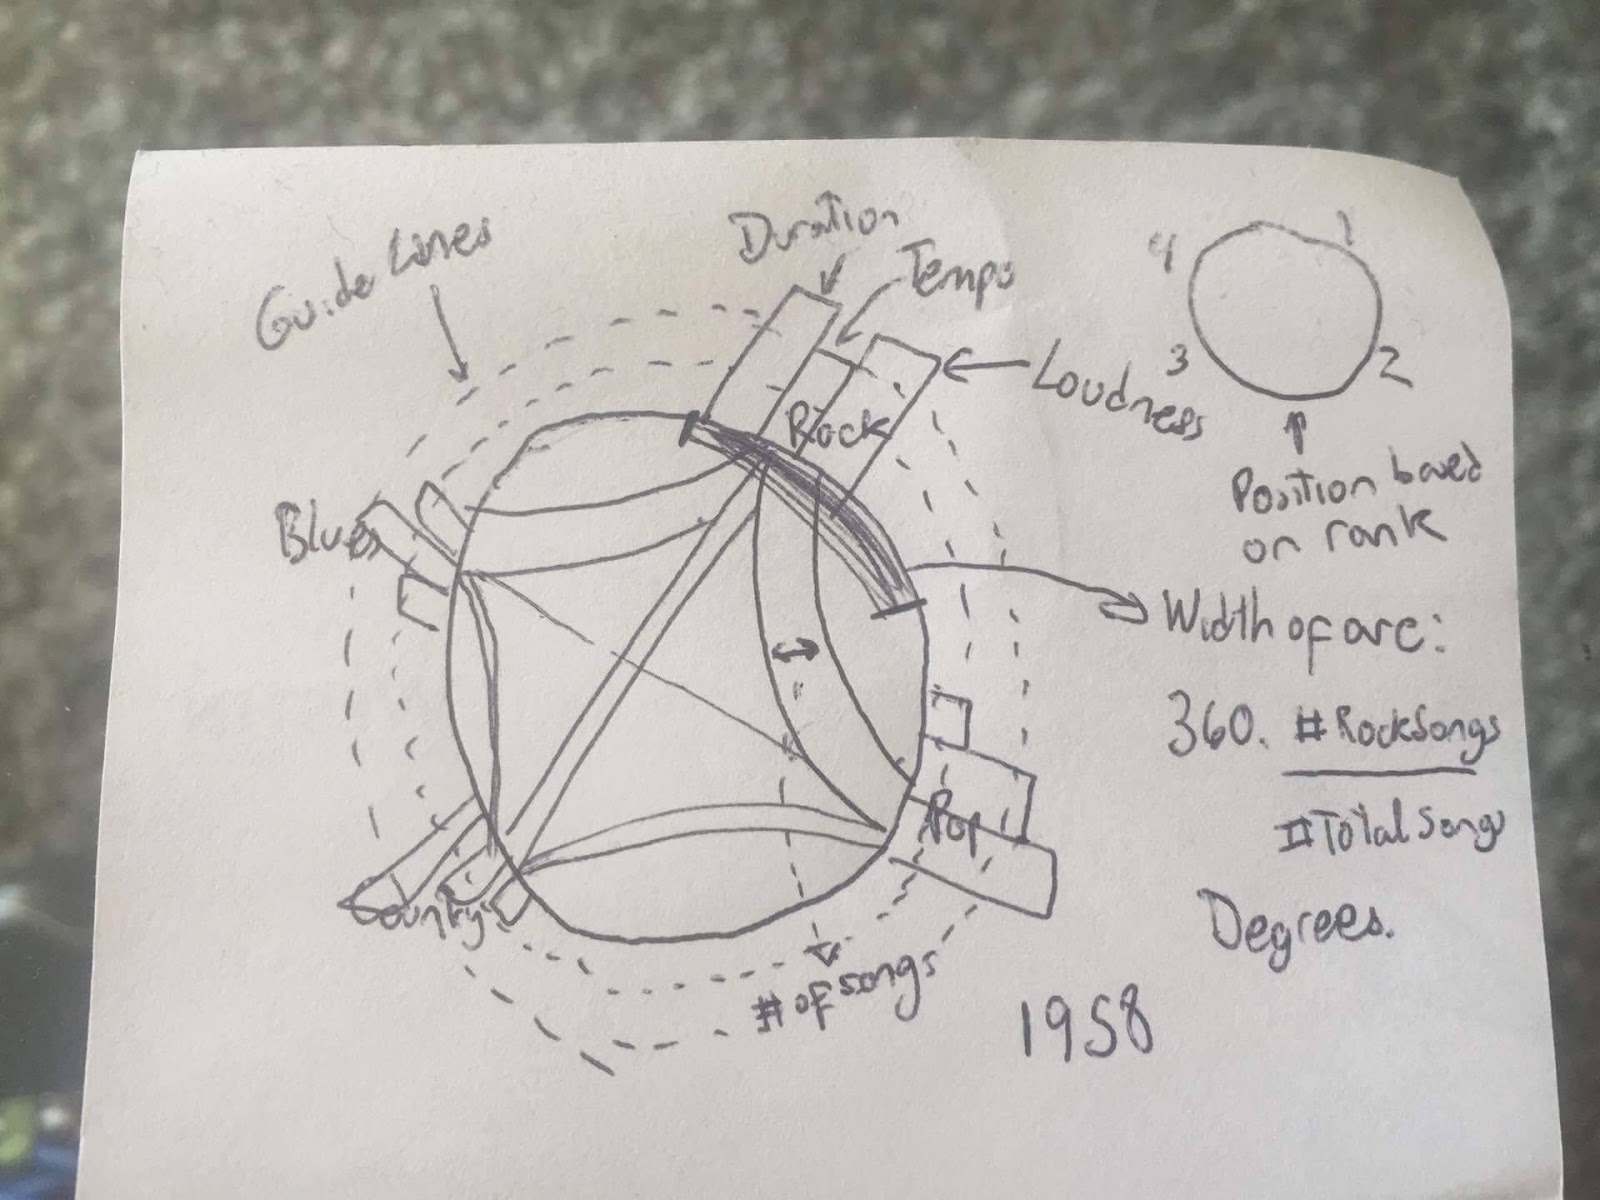
We did, however develop a new design that shows variation over time. This plot is one of our final sketches that we ended up implemented. It is a chord diagram which shows compatibility between genres based on the number of shared songs. Shared songs are the songs tagged with both genres that the chord links. Width of the chord indicates the number of shared songs, and length of the arc indicates proportion of songs for that genre.
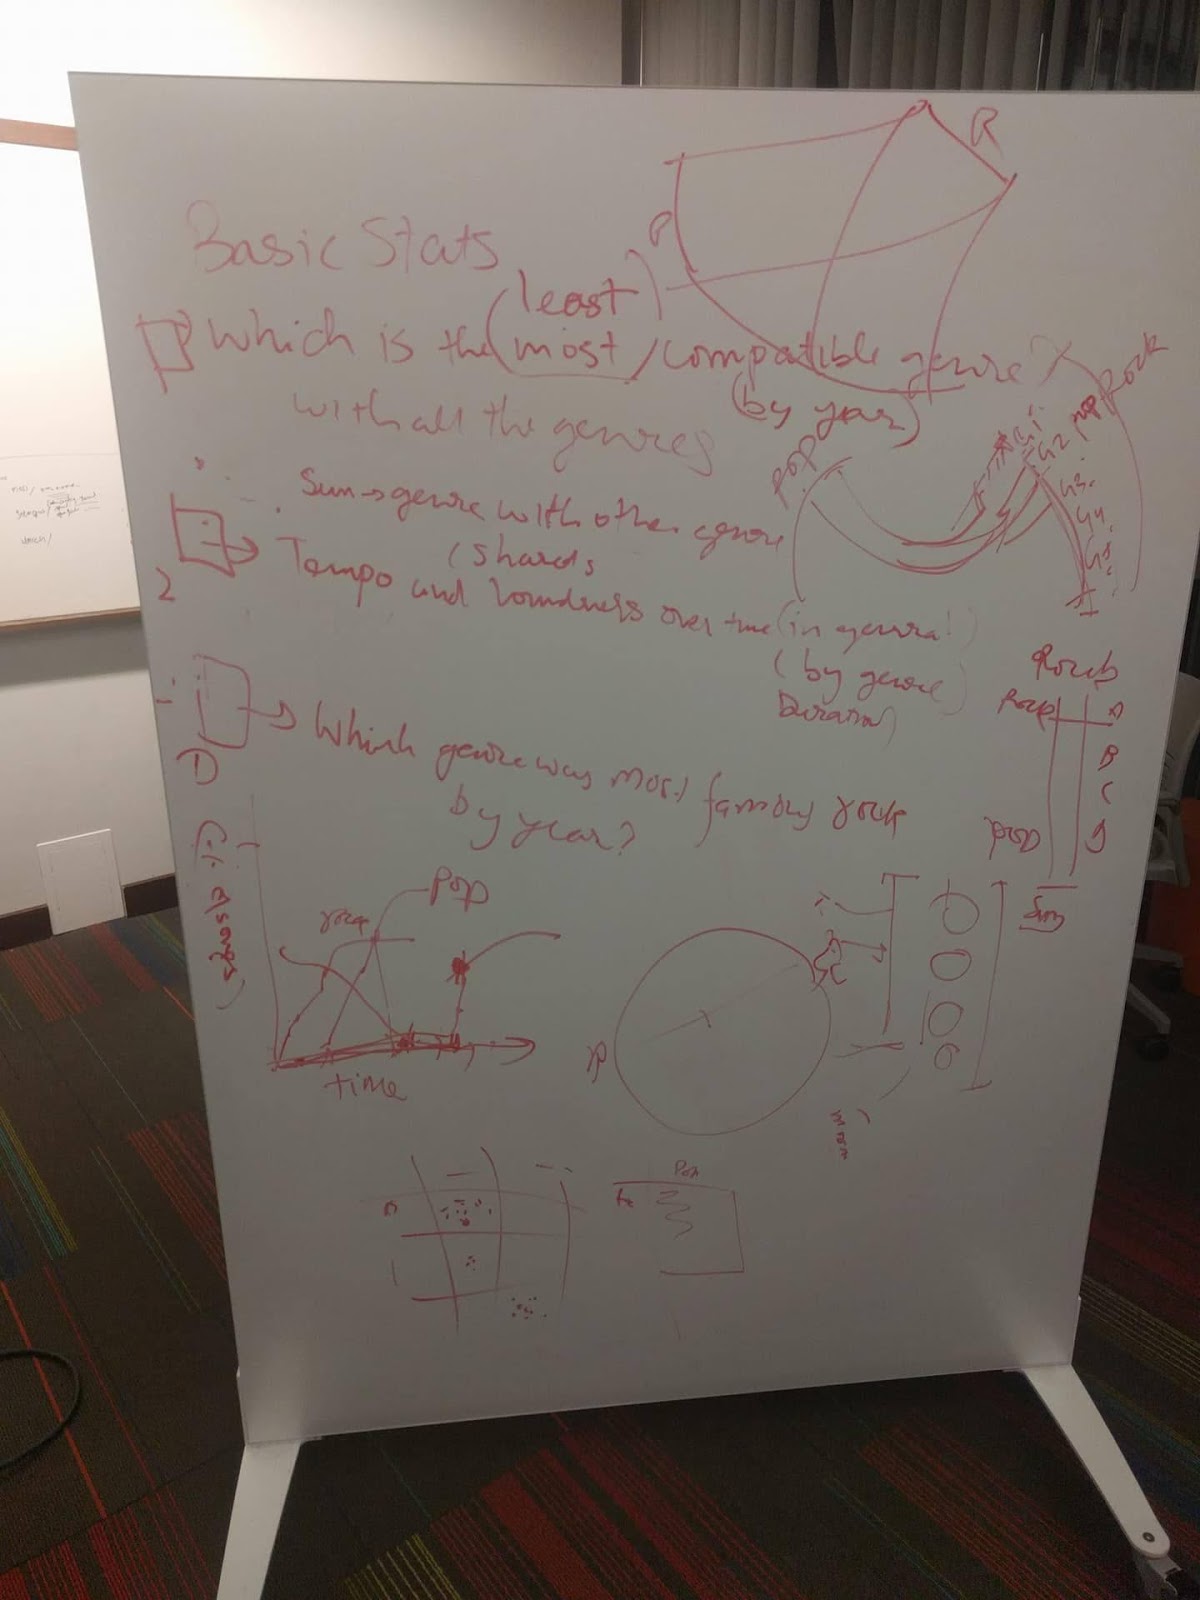
We decided to build this chord diagram for each decade and use a slider to switch between decades. This enables the users to compare different decades and answer questions like – how compatibility has changed over decades, what are the new genres that have emerged, which genre is most popular in each decade, etc. We also visualized proportion of songs by genre over time through a line plot to better understand emergence of fusion genres.
Heatmaps
To explain the similarity based on acoustics, we are using heatmaps. The similarity measures are normalized for each genre and shaded from red (high similarity) to yellow (low similarity). These heat matrices helped us explain the compatible pairs we see in chord diagram.